












Hydrology, Vol. 11, Pages 7: Analysis of Anomalies Due to the ENSO and Long-Term Changes in Extreme Precipitation Indices Using Data from Ground Stations
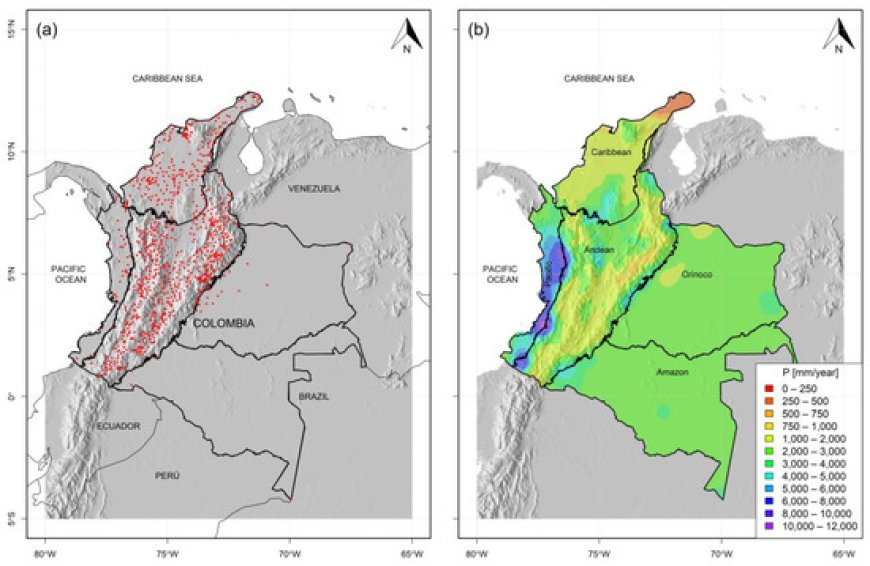
In this work, the influence of the El Niño Southern Oscillation (ENSO) on the Extreme Precipitation Indices (EPIs) was analyzed, and these ENSO-forced anomalies were compared with the long-term change in the EPIs. The annual time series of the EPIs were built from 880 precipitation stations that contained daily records between 1979 and 2022. These daily time series were filled, then the eleven (11) annual time series of the EPIs were built. To calculate ENSO-driven anomalies, the several phases of the phenomenon were considered (i.e., warm phase or El Niño years, cold phase or La Niña years, and normal or neutral years). For a particular EPI, the values calculated for the extreme phases of the ENSO were grouped, and these groups were compared with the group made up of the EPI values for the neutral years. To calculate the long-term change, two periods (1979–1996 and 2004–2021) were considered to group the EPI values. Maps showing the magnitude and significance of the assessed change/anomaly were constructed. The results allowed us to identify that the EPIs are generally “wetter” (i.e., higher extreme precipitation, longer wet periods, shorter dry periods, etc.) during La Niña hydrological years, while the opposite changes are observed during El Niño years. Furthermore, ENSO-induced anomalies are more important than the long-term changes.
Hydrology, Vol. 11, Pages 7: Analysis of Anomalies Due to the ENSO and Long-Term Changes in Extreme Precipitation Indices Using Data from Ground Stations
Hydrology doi: 10.3390/hydrology11010007
Authors: Luis Alberto Vargas-León Juan Diego Giraldo-Osorio
In this work, the influence of the El Niño Southern Oscillation (ENSO) on the Extreme Precipitation Indices (EPIs) was analyzed, and these ENSO-forced anomalies were compared with the long-term change in the EPIs. The annual time series of the EPIs were built from 880 precipitation stations that contained daily records between 1979 and 2022. These daily time series were filled, then the eleven (11) annual time series of the EPIs were built. To calculate ENSO-driven anomalies, the several phases of the phenomenon were considered (i.e., warm phase or El Niño years, cold phase or La Niña years, and normal or neutral years). For a particular EPI, the values calculated for the extreme phases of the ENSO were grouped, and these groups were compared with the group made up of the EPI values for the neutral years. To calculate the long-term change, two periods (1979–1996 and 2004–2021) were considered to group the EPI values. Maps showing the magnitude and significance of the assessed change/anomaly were constructed. The results allowed us to identify that the EPIs are generally “wetter” (i.e., higher extreme precipitation, longer wet periods, shorter dry periods, etc.) during La Niña hydrological years, while the opposite changes are observed during El Niño years. Furthermore, ENSO-induced anomalies are more important than the long-term changes.
What's Your Reaction?